

- Karnaugh Map Definition: A Karnaugh map (K-map) is defined as a graphical tool used to simplify Boolean expressions in digital systems.
- Gray Code Sequence: K-maps use a Gray code sequence, ensuring that adjacent cells differ by only one bit, making it easier to identify groups with the same output.
- Simplification Process: To simplify Boolean expressions using K-maps, fill the table, group cells with the same values, and write terms for each group.
- Advantages of K-maps: K-maps are visual and intuitive, requiring no deep knowledge of Boolean algebra, and can handle ‘don’t care’ conditions.
- Disadvantages of K-maps: They become impractical with more than four or five variables and may not always yield optimal solutions.
A Karnaugh map (K-map) is a graphical tool that simplifies Boolean expressions in digital systems. Developed by Maurice Karnaugh in 1953, it improved upon the Veitch chart, based on Allan Marquand’s earlier work. K-maps are particularly useful for designing digital logic circuits with few input variables, like switches or transistors.
What is a Karnaugh Map?
A Karnaugh map is a two-dimensional table that represents the output values of a Boolean function for all possible combinations of input values. The input variables are shown as binary codes along the rows and columns of the table, and the output values are written inside the cells. The binary codes are arranged in a Gray code sequence, which means that any two adjacent cells differ by only one bit. This property makes it easier to identify and group the cells that have the same output value.
For example, consider a K-map for a Boolean function with two input variables, A and B. The output is 1 for the combinations AB = 00, 01, 10, and 11. These cells are marked with 1s, while others are marked with 0s.
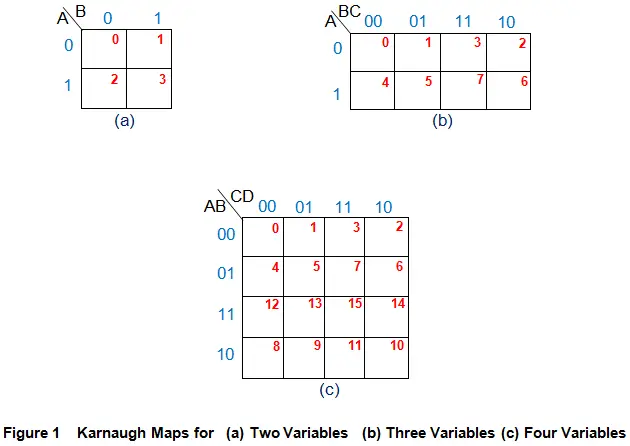
Figure 1: A K-map for a two-variable Boolean function
The size of a K-map depends on the number of input variables. In general, if there are n input variables, then the K-map has 2^n cells. For example, if there are three input variables, then the K-map has 8 cells, and if there are four input variables, then the K-map has 16 cells. Figure 2 shows the K-maps for three and four input variables.
Figure 2: K-maps for three and four input variables
How to Simplify Boolean Expressions Using K-maps?
K-maps simplify Boolean expressions by finding the fewest terms to represent the output. A term can be a product (AND) or a sum (OR) of input variables or their complements. For example, AB means A AND B, while A + B means A OR B.
To simplify a Boolean expression using a K-map, we need to follow these steps:
- Identify the output function that we want to simplify. It can be given as a sum of products (SOP) or a product of sums (POS) form.
- Construct a K-map for the output function and fill in the cells with 1s or 0s according to the output values for each input combination.
- Group the cells that have the same output value (1s for SOP or 0s for POS) into rectangular regions that contain the powers of two cells (1, 2, 4, 8, etc.). The regions can overlap and wrap around the edges of the table. The goal is to form as few and as large regions as possible.
- Write a term for each region by identifying the common factors among the input variables in that region. For example, if a region covers the cells where A = 0 and B = 1, then the term is A’B (A compliment AND B).
- Combine all the terms with OR operations (for SOP) or AND operations (for POS) to obtain the simplified expression.
Example: Simplifying a Boolean Expression Using a K-map
Let us consider an example of simplifying a Boolean expression using a K-map. Suppose we have a Boolean function F with three input variables A, B, and C given as:
F = ABC + AB’C + A’BC + A’B’C
This is an SOP form with four terms. We can construct a K-map for this function as shown in Figure 3.
Figure 3: A K-map for F = ABC + AB’C + A’BC + A’B’C
We can see that there are four cells with 1s corresponding to the four terms in the expression. We can group these cells into two regions: one region with two cells where A = 0 (marked in blue) and another region with two cells where B = C (marked in green). The terms for these regions are:
- A’ (for blue region)
- BC + B’C’ (for green region)
We can combine these terms with OR operations to get the simplified expression:
F = A’ + BC + B’C’
This expression has only three terms instead of four, and it is equivalent to the original expression.
Advantages and Disadvantages of K-maps
K-maps have some advantages and disadvantages as a method of logic simplification. Some of them are:
- Advantages:
- They do not require knowledge of Boolean algebra rules or manipulation skills.
- They provide a visual and intuitive way of finding patterns and groups in logic functions.
- They can handle don’t care conditions, which are cases where the output value does not matter for some input combinations.
- Disadvantages:
- They become difficult and impractical to use when the number of input variables exceeds four or five.
- They may not always yield a unique or optimal solution, depending on how the regions are formed and selected.
- They may not eliminate all possible race hazards, which are situations where changes in input values cause unwanted changes in output values due to different propagation delays in logic gates.
Related Graphical Methods
K-maps are not the only graphical method for logic simplification. There are some other methods that are similar or related to K-maps, such as:
- Veitch charts: These are similar to K-maps but use different arrangements of binary codes along the rows and columns.
- Quine–McCluskey algorithm: This is an algorithmic method that uses tabular forms to find all possible prime implicants (minimal terms) of a logic function and then select a subset that covers all minterms (output values).
- Espresso heuristic logic minimizer: This is an iterative method that uses heuristic rules to reduce the number of terms and literals (input variables or their complements) in a logic function.
- Binary decision diagrams: These are graphical representations of logic functions using nodes and edges that show how output values depend on input values.
Conclusion
In this article, we have explained what Karnaugh maps are and how they work as a graphical tool for logic simplification. We have shown how to construct and use K-maps for different types of Boolean functions and how to obtain the minimum number of terms that can represent the output function. We have also discussed the advantages and disadvantages of K-maps and some related graphical methods that can be used for similar purposes.
K-maps are a useful technique for designing digital logic circuits with a small number of input variables, as they can reduce the complexity of Boolean expressions without requiring complex algebraic manipulations. However, they have some limitations, such as difficulty in handling more than four or five input variables, possible non-uniqueness or suboptimality of solutions, and potential race hazards.
K-maps are not the only graphical method for logic simplification. There are other methods, such as Veitch charts, Quine–McCluskey algorithm, Espresso heuristic logic minimizer, and binary decision diagrams, that can be used to simplify Boolean expressions in different ways. Depending on the nature and size of the logic function, some methods may be more suitable or efficient than others.
K-maps are an important topic in digital electronics and computer science, as they provide a visual and intuitive way of understanding and manipulating logic functions. By learning how to use K-maps, one can gain a better insight into the logic behind digital systems and improve their design and performance.